nanoFLeye™
The Way to a Deeper Insight into the Cell
nanoFLeye™ (nanoFluorescenceEye) is the innovative reply on demands and needs in the field of superresolving optical imaging based on the localization microscopy technique SPDM (spectral precision distance microscopy).
nanoFLeye™ excels with
3D Multicolour Imaging based on SPDM
High Stability
High Flexibility
Choose up to Four Different Excitation Wavelengths Suitable to your Desired Dyes
Choose your Favoured Microscope Objective
Clear and User-Friendly Interface
Possibility of Remote Control
Opportunity of High Level Automatization such as Autofocus, Easily Programmable Measurement Sequences and Automated Data Analysis
APPLICATION EXAMPLES
nanoFLeye™ allows to reveal structures well below the Abbe limit being of interest for biomedical as well as material science applications.
The inverted setup of nanoFLeye™ and its flexible sample holder allows for the investigation of a huge variety of sample configurations.
Protein-Polymers in a Cell Culture Specimen
The images show a segment of fluorescence-labeled microtubules in a cell culture (HeLa-cells)
nanoFLeye™ uncovers sub-structures within the polymer configuration
The corresponding linescans show the intensity distribution along the implied line in the images
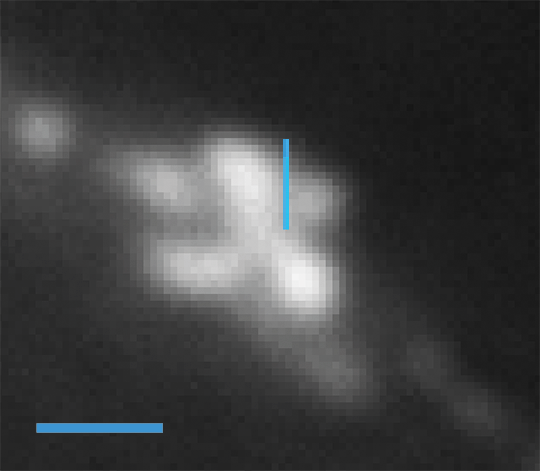
Conventional epifluorescent microscopy image of Alexa647-labeled microtubuli of HeLa-cells; scale bar 1µm.
Super-resolved image of the identical sample position recorded by nanoFleye™; scale bar 1µm.
Linescan (vertical line in the upper image) of the epifluorescent image.
Linescan (vertical line in the upper image) of the super-resolved image.
Alexa680-labeled human platelets (HuPLTs, PF4, A680, native)
Sample preparation courtesy of: Dr. M. Schmitt, LMU München
Left: conventional epifluorescent microscopy image
Right: superresolved image recorded by nanoFLeye™
Human Thrombocytes
The images show the PF4 distribution inside the platelets
nanoFLeye™ uncovers the number of the labeled cytokines as well as their formation in the platelets
Conventional epifluorescent microscopy image of Alexa680-labeled HuPLTs; scale bar 1µm.
Super-resolved image of the identical sample position recorded by nanoFLeye™; scale bar 1µm.
Protein-Polymers in a Tissue Sample
Epifluorescence (30µm x 30µm),
scale bar 5µm
Immunofluorescence micrographs
of a 30µm thick rat brain tissue
ICV 10 Hippocampus (DG)
Staining: microtubules (Alexa647)
The images show a segment of fluorescence-labeled microtubules in 30µm thick rat brain tissue
The histogram shows the distribution of the localization accuracy of the detected events.
A mean localzation accuracy of 18nm could be achieved
Mean localization accuracy: 18nm
Sample preparation courtesy of:
Dr. Sebastian Bauer
Leiter AG Translationale Epileptologie
Epilepsiezentrum Frankfurt Rhein-Main
Klinik für Neurologie
Goethe Universität Frankfurt
Epifluorecence; scale bar 1µm.
Super-resolved image of the identical section; scale bar 1µm.
The images show Cos-7-cells recorded via standard widefield fluorescence microscopy
FlexTM
The cells where stained with DAPI for nucleus (blue), Alexa Fluor 488 for mitochondria (cyan), TMR for microtubules (green) and SiR for actin (red)
Stained Cos-7-Cells
Consecutively recorded monochrome images with different laser wavelength
From left to right: 405nm, 488nm, 561nm, 647nm
Colorized pictures beneath
Right picture shows the four merged channels with an amplified crop
Different sample pictures of the mentioned Cos-7-cells
SPECIAL FEATURE
nanoFLeye™ is equipped with the pioneering ReconFlex™ camera developed by Surface Concept GmbH making localization microscopy substantially easier and faster.
here.
METHOD
Conventional fluorescence microscopy is a versatile tool to perform functional cell biology analysis. Fluorophores are being coupled to antibodies which bind to their corresponding proteins in the cell. By analyzing the fluorescence signals in the microscopy image, one can get insight to the distribution of the chosen proteins inside the cell.
However, in terms of nano-science and detailed insight into biological processes on a molecular level, convential fluorescence microscopy is stretched to its limit.
In an epifluorescence microscope the lateral resolution is determined by the diffraction limit, i.e. you cannot distinguish two molecules having a distance less than ~200nm from each other. In a confocal setup it is possible to improve the resolution slightly, but not sufficient to detect single molecules.
Localization Microscopy
Spectral Precision Distance Microscopy (SPDM):
Spectral features are used to achieve optical isolation
1.
2.
3.
4.
In Conventional Fluorescence Microscopy the Full-Width-at-Half-Maximum (FWHM) of the Point-Spread-Function (PSF) >200nm. Signals of adjacent dyes overlap, therefore single molecules cannot be resolved
Using SPDM, randomly activated dyes are „optically isolated“, i.e. no overlap of the signal of adjacent molecules can occur
The locations of the optically isolated fluorophores are determined by the localization algorithm with a precision down to 20nm
All localizations found in a stack of usually ten thousands of images are displayed in a single reconstructed super-resolved image
MORE INFORMATION
CONTACT
Surface Concept GmbH
Am Sägewerk 23a
55124 Mainz
Germany
phone: +49 6131 62716 0
fax: +49 6131 62716 29
email: info@surface-concept.de
Contact us here.